
edCircuit
  • Start Here
    • Login
    • Register
    • Subscribe
    • Submit a Press release
    • Advertise or Sponsor
    • Contribute
    • Get Interviewed
  • On the Wire
  • EdTech
    • All EdTech
    • Online Learning
    • Hybrid and Remote Learning
    • Augmented and Virtual Reality
    • ESports
    • Gamification and Game-Based Learning
    • Digital Citizenship
    • EdTech Entrepreneurs
    • Market Trends
    • Future of Education
  • Artificial Intelligence
  • K-12 Education
    • All K-12
    • K-12 Teachers
    • Teaching Strategies
    • Special Education and IEPs
    • Dyslexia
    • Gifted and Advanced Learning
    • Early Childhood, Pre-K and Kindergarten
    • School Calendar
    • Tutoring and Homework Help
    • Attendance and Absenteeism
    • After-School Programs
    • School Counselors
    • Homeschooling
    • School Models
    • Teacher Retention
    • Parents
    • Students
    • STEM and STEAM Education
  • Teaching and Learning
    • Literacy and Reading
    • Math Education
    • Civics and History Education
    • Financial Literacy
    • Assessment and Testing
    • Curriculum and Instruction
    • Personalized Learning
    • Project-Based Learning
    • Social-Emotional Learning
    • Executive Function
    • Creativity
    • Diversity, Equity, Inclusion
  • Professional Development
    • All Professional Development
    • Educators
    • Administrators
    • edLeaders
  • Higher Education
    • All Higher Education
    • College Admissions
    • Career and Technical Education (CTE)
    • Graduation
    • FAFSA and Financial Aid
    • Student Loans
  • Cybersecurity
  • School Safety
    • All School Safety
    • Science and Lab Safety
    • School Design and Facilities
    • Bullying
    • Duty of Care and School Liability
  • Continuing Education
    • All Continuing Education
    • Online Certificate Programs
    • Teaching Jobs and Careers
    • Teacher Appreciation
  • Education Policy and Government
    • All Education Policy
    • Department of Education
    • School Choice
    • Global
    • Advocates
  • EDU Shows
    • All EDU Shows
    • Safer Ed
    • Mind the Gap
    • Education Industry Questions
    • CoffeEd
    • InFocus
    • InformED Report
  • EDU Podcasts
    • All EDU Podcasts
    • Author Chats
    • CoSN The Podcast
    • Education Today
    • Building the Bridge
    • Students Speak
  • Education Industry Guides and Reports
  • Archived Media
    • Future of School: The Podcast
    • Equity Everywhere
  • About edCircuit
  • Subscribe
edCircuit
  • Sign in
Join Free
Home Tags Posts tagged with "Popular"
Tag:

Popular

Follow
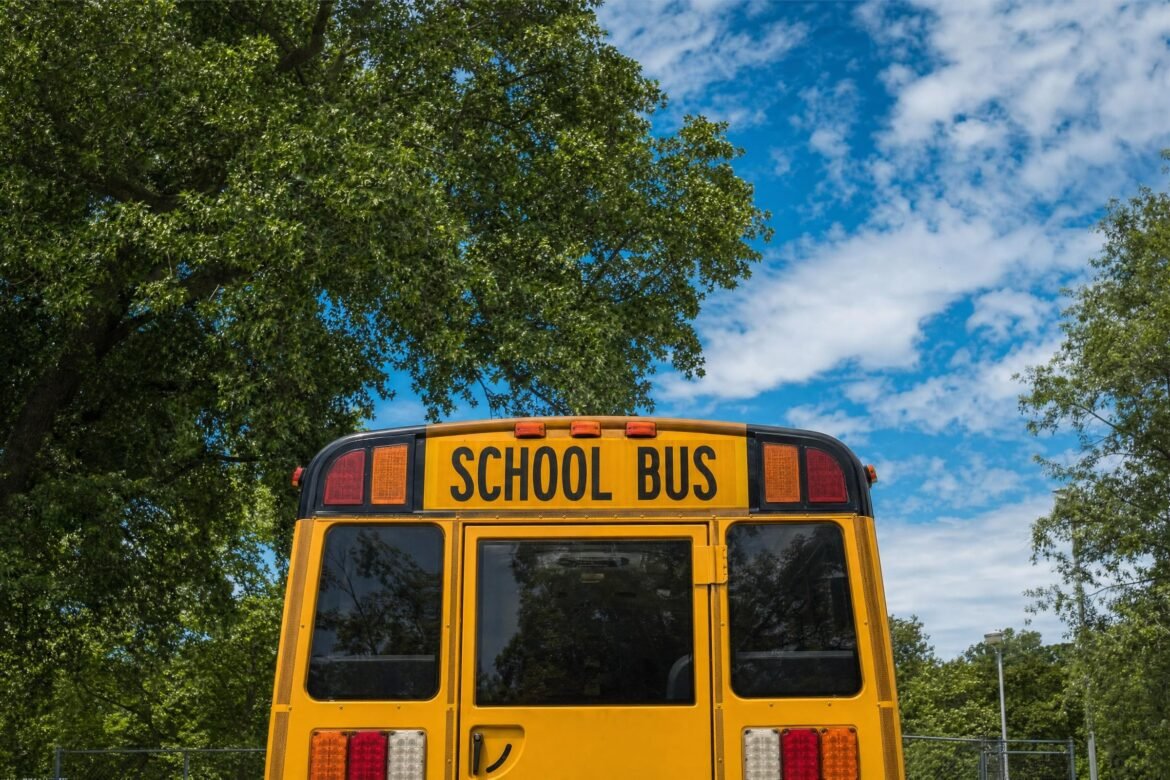
The back of a yellow school bus with SCHOOL BUS on its rear sign, parked under green leafy trees against a blue sky with white clouds
School ChoiceK-12AdministratorsMarket Trends

Marketing of Public Education Is on the Rise

by Jim Reams February 19, 2018
written by Jim Reams 2 minutes read

edCircuit Breakdown

At the Upper Darby School District in Pennsylvania, people are used to seeing marketing materials like billboards and slick brochures that charter and private schools use to increase enrollment. What’s relatively new is the the public school district getting into the battle. This suburban Philadelphia district has launched a marketing campaign to attract both students and staff.  “We know our story, and we want to be able to tell our story, and I think there is a public perception of public education that doesn’t reflect Upper Darby in particular,” says Dana Spino, director of district media relations.

A school district in Indiana had an aggressive marketing campaign in place to increase enrollment at schools and get the word out about what the school corporation has to offer. However, questions about return on investment and the perception that the school corporation is poaching students from nearby areas prompted the school board to reduce the amount of spending on the campaign from $190,000 to just over $85,000.

In his book, “Beyond Test Scores: A Better Way to Measure School Quality,” Jack Schneider makes the argument that the main difference between public schools and private or charter schools isn’t the test scores, it’s marketing. He takes a deep dive into performance at all types of schools, especially the number of kids graduating and continuing on to college.

edCircuit Analysis

Robust enrollment in charter and private schools plus the increased pressure on enrollment numbers on public school funding is forcing a change in attitude about marketing in some districts. Many public school administrators have a hard time getting over the perception that spending money to promote a public institution is distasteful and a waste of money, but more and more are realizing marketing has to be part of the overall plan for healthy growth in a district.

kids singing in a play“If we just go out and spend money aggressively on heavy marketing, we might receive a lot of criticism for that,” says Fred Brent, Superintendent of Georgetown ISD in Texas. “But a charter school can do that. That’s their business model, and they’re a for-profit business. Make no mistake about it. They’re making money.

“School boards need to say to themselves, ‘This is a competition now; the game has changed. We must start marketing ourselves.’ And teachers need to brag about themselves. Great things are happening in our schools and teachers have been conditioned to not tell their story, to not talk about the great things their kids are doing.”

Author

Jim ReamsJim Reams is a marketing, communications and strategy consultant with over 25 years experience in both in-house and agency settings. He has specialized in EdTech and the education industry since 2009. He has a BA degree from the University of North Texas.

February 19, 2018 0 comments
0 FacebookTwitterPinterestLinkedinWhatsappCopy LinkEmail
Colorful speech bubbles rising like balloons over a diverse classroom, more English learners
Curriculum and InstructionK-12

Number of English Language Learners on the Rise

by Jim Reams February 15, 2018
written by Jim Reams 6 minutes read

In February 2018 Jim Reams wrote an edCircuit report on rising numbers of English language learners, with examples from Norwalk, Idaho and Chicago. Below it, a 2026 update adds the most recent federal figures on who these students are and where they attend school.

Are we doing enough to help ELL students?

edCircuit Breakdown

In Norwalk, CT, the district is seeing remarkable progress for students in their ELL program. According to Superintendent Steven Adamowski, Norwalk has become a district of choice for ELL students, partly because of their success among the district’s ELL students. Several ELL students have become valedictorians recently.

Norwalk is increasing their budget for ELL teaching, which cost approximately 30% more per student than teaching native English speakers. In Idaho, there is a $3.87 million line item in the budget for ELL education, which translates to $210 per student. That is down from $250 per student just two years ago, and lawmakers are hoping to increase the line item number by $1 million.

In Chicago, two students were honored who showed the most improved academic improvement in the Niles Township High School District 219, Niles North junior Joselyne Ramos-Jacobo and Niles West junior Rami Roeil. Both students are products of the school’s ELL program. “Joselyne is a great student,” according to ELL teacher Fred Wulfram. “She has shown the drive and desire to learn through her effort in and out of the classroom, and it shows with her consistent great results in all areas of learning: listening, speaking, reading and writing! She is a pleasure to have in class.”

edCircuit Analysis

With immigrant population from around the world increasing in many U.S. school districts, the need for effective ELL programs and teachers to run them become magnified. A lack of mastery of the language results in poor performance in school, discouraging kids and often leading to them dropping out.

In Texas, 52% of all public school students are categorized as Hispanic, and the makeup of Hispanics in the general population is rising. One teacher in Austin sees opportunity in ELL programs to improve standardized test scores in an unexpected subject, math.

Joy Lin, an educator in Austin, and an academic advisor to Sentence Analytics sees otherwise excellent math students get stymied by math questions on tests not because of the mathematics, but because of the wording of the problems. Complex word problems make math tests more of an English test for these kids, and she sees opportunities to improve outcomes through sentence diagramming. “You have to break down the sentence to realize what words are the important verbs or important nouns and what words are just descriptive,” she says. “You’re trying to get the essence of what the sentence is saying.”

ELL programs in schools in 2026: who is enrolled and what leaders should plan for

ELL programs in schools serve a larger share of students than when the report above was written, and the most recent federal numbers show where the growth is. The term English language learner is still common in schools, while the National Center for Education Statistics (NCES) uses the term English learner. Both describe students who are developing English proficiency while they study grade-level content. The figures below come from the NCES Condition of Education indicator, last updated in May 2024, and describe fall 2021.

How many students, and where

English learners were 10.6 percent of public school students in fall 2021, about 5.3 million students, up from 9.4 percent, or 4.6 million, in fall 2011. Enrollment dipped to 5.0 million in fall 2020 and rose again the next year. The share differs widely by state. Texas had the highest at 20.2 percent, followed by California at 18.9 percent and New Mexico at 18.8 percent, while West Virginia had the lowest at 0.8 percent. Thirteen states and the District of Columbia had shares of 10 percent or more. Between 2011 and 2021 the share rose in 38 states and the District of Columbia and fell in 12, with Rhode Island showing the largest increase at 6.9 percentage points.

Location matters for planning. The share was 9.8 percent in cities, 7.9 percent in suburbs, 7.5 percent in towns and 4.8 percent in rural areas. A rural or small-town district with a few English learners spread across several schools faces different choices from a city district with hundreds.

Grade levels and home languages

English learners are concentrated in the youngest grades: 14.7 percent of kindergartners, compared with 10.5 percent of sixth graders, 9.0 percent of eighth graders and 6.1 percent of twelfth graders. The indicator does not explain the pattern. For a principal it suggests kindergarten and early elementary teachers are most likely to need training and support.

Spanish was the home language of 76.4 percent of English learners, about 4.0 million students. Arabic followed at 2.5 percent, then English at 2.2 percent, Chinese at 1.8 percent and Vietnamese at 1.4 percent. Language diversity is growing at the edges: the number of English learners with Swahili as a home language rose from about 6,000 in 2011-12 to 21,800, and Portuguese from 15,700 to 50,200. A district can have a strong Spanish-language plan and still need interpreters, family outreach and materials for languages it has not served before.

Services and students with disabilities

About 93.1 percent of English learners, 4.9 million students, received services in English language instruction educational programs in fall 2021, down from 94.5 percent in fall 2011. The share varied by state: Georgia had the lowest at 48.9 percent and Illinois 55.3 percent. NCES also reports that 15.8 percent of English learners were students with disabilities, compared with 14.7 percent of all public school students, which means districts need ways to tell language development needs from disability needs and to serve students who have both.

What this means for the examples in the original

The 2018 report described Norwalk’s budget for English learners and a line item in Idaho, along with student honors in Chicago. Those budget figures are from 2018, and this update did not verify current spending in either place, so they should be read as examples from that year. The numbers above support the report’s central point that more districts need effective programs and trained teachers. The report’s Austin example, in which a teacher saw otherwise strong math students held back by the wording of test questions, is covered in more detail in edCircuit’s article on the English inside math exams.

A leader reading these figures can take three steps: look up the district’s own share of English learners by school and grade, list the home languages of enrolled students rather than assuming one, and ask whether early-grade teachers have the time and training the kindergarten numbers suggest they need.

February 15, 2018 0 comments
0 FacebookTwitterPinterestLinkedinWhatsappCopy LinkEmail
Statue of liberty new york
K-12

The DACA Reversal and Education

by Jim Reams January 19, 2018
written by Jim Reams 2 minutes read

How is the recent policy change affecting students and the education system?

edCircuit Breakdown

A recent survey shows that there is no clear consensus on the impact of immigrants on education among educators. 44 percent of the respondent of the poll said the impact of immigrants on education was mixed, while an additional 38 percent said it was a good thing. While those results are vague, it should be noted that only 8 percent of those surveyed thought the impact of immigrants on education was bad.

The Trump administration recently ordered a shift away from DACA protections, claiming that it would create more economic opportunities for American citizens. While the impact on American workers can be debated, a study shows that the program definitely helped immigrant workers get ahead in life, increasing the rate of employment, the amount of wages received and the level of education.

Luz Garcini at Rice University has been studying the stress pressures the repeal of the act is having on DACA recipients. She found undocumented immigrants between the ages of 18 and 25 showed the most stress. Many in this group only have memories of being in America and are English speakers. “Literally, they almost perceive themselves as being U.S. born,” she said.

edCircuit Analysis

The Deferred Action for Childhood Arrivals (DACA), was an Obama administration policy that basically protected immigrants who were brought to the U.S. illegally as children from deportation and other legal actions against them. The thought behind it was that they had no control over the act of being brought here and shouldn’t be punished retroactively for the actions of their parents or caregivers.

Brown Eyed GirlWhile there may be little argument about the overly simplistic math logic behind eliminating illegal immigrants from the job pool resulting in more job opportunities for American citizens, you can debate the moral aspect of punishing people for actions that were taken by their parents or caregivers when they were children.

In education, one vocal proponent of DACA is Dr. Robert Avossa, superintendent of Palm Beach County Schools, the tenth largest school district in the country. Robert has an insider’s view of the struggles that child immigrants go through as he was an immigrant himself. Cultural changes and the inability to speak the language can put stress on a child’s psyche, and Robert thinks that the repeal of DACA unnecessarily adds to that pressure.

The DACA repeal is just one issue in a long list of policy mandates handed down by the current administration. Hopefully, those in power in Washington will take into account the effect these policy decisions have on our education system and the children who populate it.

January 19, 2018 0 comments
0 FacebookTwitterPinterestLinkedinWhatsappCopy LinkEmail
A smiling young woman studying at a kitchen table with an open workbook beside her laptop, a glass of juice nearby, warm natural daylight in a home
GlobalMarket TrendsOnline LearningAugmented and Virtual RealityHigher Education

Distance Learning on the Rise

by Jim Reams January 11, 2018
written by Jim Reams 2 minutes read

The number of students taking online courses is up

edCircuit Breakdown

A recent study shows that the number of students taking at least one online course as a college undergrad is up over previous years. The study, done by Babson Research Group which used data from more than 4,700 universities, shows that over six million students took at least one online course in 2015-2016. This is the 14th consecutive year Babson has reported growth in distance learning.

In Africa, more and more students are turning to online courses in primary, secondary and tertiary grade levels. This movement is a hopeful sign in a continent that is in need of educational reform.

In the U.S., the movement doesn’t include online classes for getting an accredited law degree. The American Bar Association currently has no completely online programs accredited for a J.D. degree. Some blame the law profession’s traditional unwillingness to embrace changes.

edCircuit Analysis

Old Connect to computer graphicNow that connectivity and access to all the information in the world with a tap of the finger is accepted as a way of life, more people are embracing technology to make learning more accessible and more convenient for students and educators alike. The fact that distance learning is on the rise at the college and university level shows that acceptance is spreading and students and institutions are accepting online courses as legitimate avenues for taking classes.

As we look forward, we need to take into account distance and blended learning opportunities when designing our “perfect” schools of the future.

While effective pedagogy and curriculum will remain vital, we need to look for the opportunities that global connectivity present in education. It will be more than BYOD or Chromebooks in schools. With virtual reality technology and real-time file sharing and collaboration becoming affordable, we are looking at a globally connected education landscape the likes of which the world has never seen.

January 11, 2018 0 comments
0 FacebookTwitterPinterestLinkedinWhatsappCopy LinkEmail
Smiling teenage students in white polo shirts and safety glasses working together at a school lab bench with blue liquid in flasks, bright classroom daylight
Higher EducationK-12Market TrendsSTEM and STEAM Education

STEM Education in the U.S. is “Middling”

by Jim Reams January 10, 2018
written by Jim Reams 1 minutes read

Despite mediocre results, the push for STEM and STEAM goes on

A large number of students who begin college as STEM majors switch to another field of emphasis. Some say it is because STEM classes at the college level are so much harder than what students experienced in high school.

Despite many initiatives by the government to increase awareness for STEM education, especially by girls and minorities, STEM education is perceived as “middling” in the U.S. Only 25% of Americans think STEM education in the U.S. is above average compared to other countries around the globe.

Despite the perception that STEM education is mediocre in the U.S., more and more schools are teaching computer science than ever before. In 2017, many states moved forward with legislation to make teaching computer science mandatory.

edCircuit Analysis

People involved in education at all levels have been hearing about increasing awareness for STEM and STEAM teaching for several years. This call for awareness has received mixed results in determining how many students choose STEM-focused studies, but the push isn’t slowing down, nor should it.

Steaming cup of coffeeWhile grants and government mandates help increase the attention of students considering a STEM or STEAM-focused education, awareness doesn’t always translate into action.

Joshua Sneideman thinks that one of the solutions to get more students interested is to tell more stories of STEM career possibilities.  He believes starting in late elementary and middle school would allow students to form a practical picture in their minds about the kind of life they could have by studying STEM and STEAM subjects.

January 10, 2018 0 comments
0 FacebookTwitterPinterestLinkedinWhatsappCopy LinkEmail
A young child painting with watercolors, wearing a cute printed shirt, engaging
Market TrendsDiversity, Equity, InclusionCreativityHigher EducationK-12

Arts Education Programs Are On The Rise

by Jim Reams January 4, 2018
written by Jim Reams 7 minutes read

Jim Reams wrote this edCircuit Breakdown in January 2018 about arts education programs recovering from earlier budget cuts. A new section after Reams’ text looks at the national and state data collected since, who still lacks access, and what the research on benefits does and does not show.

Arts programs are rebounding from past cuts

edCircuit Breakdown

The Los Angeles County Arts Commission recently released a report that shows that arts education in LAUSD is far more prevalent that many people expected —  89.6 percent of elementary schools–and 92.7 percent of secondary schools, to be exact. While that news is encouraging for arts education advocates, it should be noted that there are “deeply entrenched equity disparities for students of color, low-income students, and English language learners.”

Laura Fried, president of the Maine College of Art, sees the arts as a “key to navigating an ever changing world.” She thinks that education in the arts prepares students for problem solving, and looks forward to a bright future for the school.

In Philadelphia, the Barra Foundation announced over $2 million in grants to 43 area charities, many of which are arts related non-profits. “It’s just a phenomenal gift, to be able to get general operating support,” said Christine Cox, artistic and executive director of BalletX, one of the recipients. “Donors sometimes want to support specific projects, and often that can lead the organization to build too many tentacles. Having an acknowledgment of the work we’ve done from such a prestigious foundation is really gratifying and comes at a really critical time in our development as an organization.”

edCircuit Analysis

The evidence is clear that arts education benefits students outside of their chosen artistic medium in a variety of ways. Arts education improves critical thinking and allows students to better breakdown real world problems and makes them more effective in solving those problems.

music wavesSo it is good news that the trend of cutting arts programs due to budget constraints seems to be reversing. With all the evidence that subjects like theater, dance, visual arts and music are so beneficial, any trend that those programs are thriving is positive.

Another critical life skill that participation in the arts teaches is collaboration. A stellar example of this is music students in Los Angeles and Sweden using the connectivity of the internet to collaborate on music projects in real time. The bonding that occurred eventually led to trips by the students to each other’s countries, an experience they’ll never forget.

Arts education programs in 2026: who has access and what the evidence shows

Jim Reams reports above that arts education programs in Los Angeles were more widespread than many people expected, and Reams also quotes the warning about deep equity gaps. The data collected since 2018 supports both statements. Most students attend a school that offers some arts instruction, and a smaller group, concentrated in particular kinds of schools, does not. This section uses national and state data to describe access and participation, and explains how to read the claims made about the benefits of arts education.

How many students have access

The most complete national picture comes from the State Arts Education Data Project, which collects data from state education agencies. The National Endowment for the Arts discussed its first multi-state report, which covered the 2018-19 school year, in a September 2022 Quick Study. That report drew on 17 states, over 30,000 schools and about 18 million students, roughly 36 percent of U.S. public school enrollment. In those states 96 percent of students had access to some arts education, which still left about 694,000 students without it. Researchers estimated that applying the rates nationally could mean up to about 2 million students lack access. These are 2018-19 figures; no newer national roll-up could be found for this section, so state reports such as the one below are the more current view.

Access differs by subject. Visual art and music reached about 91 to 92 percent of students, while theater reached 35 percent and dance 15 percent. Participation drops with grade level: about 86 percent of elementary students took arts classes, compared with 46 percent of high school students. The same discussion notes that students in schools with high shares of low-income students, and students in cities, very rural areas and charter schools, were more likely to lack access. It also notes that the federal government has not tracked arts education access consistently, and that the Department of Education’s own survey on the subject had not run in over a decade.

A recent state example

Annual state reports give a more current view. The Tennessee 2025 report uses 2024-25 data and shows what the gaps look like at the school level. There, 90.9 percent of students had access to at least one arts discipline and 74 percent had access to the two disciplines the state requires. Another 9.1 percent, about 95,570 students, had no access, and that rate has stayed between 9.0 and 9.5 percent since 2021. Access was 80.1 percent in high-poverty schools and 94.8 percent in low-poverty schools. Among charter schools, 64 percent offered no arts program, compared with 14 percent of traditional schools. Enrollment in arts courses was 82.1 percent in elementary schools and 44.8 percent in high schools. The report notes that some student counts are approximations read from charts.

Tennessee is one state and its figures cannot stand in for the nation. They do show the pattern Reams’ source described in Los Angeles, where overall access was high and the disparities were in who was left out. Parents and board members can look for a state report from the Arts Education Data Project, or ask the district for the number of schools without a certified arts teacher and the number of students enrolled in arts courses by grade.

What the research says about benefits

Reams’ analysis states that the evidence is clear that arts education improves critical thinking and problem solving. That claim is easy to overstate. The NEA discussion above says that arts education may help engagement and learning in other subjects and that its social and emotional benefits may help students recover from pandemic-related trauma, and it presents these as lines of research the agency is exploring, not as settled findings. A fair summary is that many studies find positive associations, that students who choose the arts may differ from those who do not, and that benefits for the arts themselves, such as skill, expression and enjoyment, need no further justification.

Reams also points to the music collaboration between students in Los Angeles and Sweden. That story, covered in Telling Student Stories Through Music, shows a specific skill, working with a distant partner, that a program can describe and a teacher can assess.

Funding and what leaders can decide

Reams cites foundation grants as one source of support. This section does not report current national funding levels for arts education, because no source on them was verified for this update. Leaders who want to know where their own district stands can start with questions that can be answered from local records:

  1. How many students at each grade level are enrolled in at least one arts course?
  2. Which schools offer no arts instruction, and are they the schools with the most low-income students?
  3. Which disciplines are offered, and does a student have a choice beyond music and visual art?
  4. If a program is cut or restored, who tracks the change and reports it to the board?

Answering these gives a school board the same kind of picture that Los Angeles County produced in 2018, and it shows whether rebounding programs are reaching the students most likely to have lost them.

January 4, 2018 0 comments
0 FacebookTwitterPinterestLinkedinWhatsappCopy LinkEmail
Newer Posts
Older Posts

Participate

  • Contribute
  • Sponsor
  • Submit Release
  • Subscribe
  • Get Interviewed
Logo with an orange lowercase letter e followed by the partially visible, faded text edCircuit on a light background.

edCircuit emPowers the voices of education, with hundreds of  trusted contributors, change-makers and industry-leading innovators.

Washington, DC

Share your voice

  • Contribute
  • Sponsor
  • Submit Release
  • Subscribe
  • Get Interviewed

Follow edCircuit

  • LinkedIn
  • X
  • Facebook
  • Pinterest

Learn more

  • Our Reach
  • edCircuit Media
  • Careers

YouTube channel

  • YouTube

@edcircuit

Copyright © 2014-2026, edCircuit Media – emPowering the Voices of Education.

We value your privacy

We use cookies to enhance your browsing experience, serve personalized ads or content, and analyze our traffic. By clicking "Accept All", you consent to our use of cookies.

Customize
  • Needed for the site to work: signing in, the cart, your consent choice. Always on.

    8 cookies
    • ss_consent 1 yearYour cookie choice on this site, so you are not asked again.
    • wordpress_logged_in_* 2 days, or 14 days with "remember me"Keeps you signed in as you move between pages.
    • wordpress_sec_* 2 days, or 14 days with "remember me"The secure half of your sign-in.
    • wordpress_test_cookie SessionChecks that your browser accepts cookies when you sign in.
    • wp-settings-* 1 yearYour display settings when signed in.
    • wp_woocommerce_session_* 2 daysYour shopping session: the cart and the checkout.
    • woocommerce_cart_hash SessionTells the site whether your cart has changed.
    • woocommerce_items_in_cart SessionWhether your cart holds anything.
  • Remembers choices you make, such as a language or a region, and supports features like live chat.

    1 cookie
    • woocommerce_recently_viewed SessionThe products you looked at, so the site can show them again.
  • Helps us understand how visitors use the site: which pages are read, and for how long.

    2 cookies
    • _ga 2 yearsGoogle Analytics: tells one visitor from another. Set only after you allow analytics.
    • _ga_* 2 yearsGoogle Analytics: keeps your session state. Set only after you allow analytics.
  • Measures how fast pages load so we can make them faster.

  • Used to show you content and offers that match your interests, on this site and elsewhere.

    1 cookie
    • sbjs_* SessionWooCommerce order attribution: where you came from, so a purchase can be credited to the campaign or site that sent you.

Your browser asks us not to sell or share your information (Global Privacy Control), so advertising cookies stay off.

Do not sell or share my personal information

Some cookies from other companies help show you offers on other sites. Tick the box and save your preference to opt out of that sharing; untick it to opt back in at any time.

Your browser sends Global Privacy Control, so this preference is set for you and cannot be changed here.

Sign In

Keep me signed in until I sign out

Forgot your password?

Password Recovery

A new password will be emailed to you.

Have received a new password? Login here

Shopping Cart

Close

No products in the cart.

Close
-
00:00
00:00

Queue

Update Required Flash plugin
-
00:00
00:00

Your cart (items: 0)

Products in cart

Product Details Total
Subtotal $0.00
Shipping and discounts calculated at checkout.
View cart
Go to checkout

Your shopping cart is empty

Return to shop

Notifications