


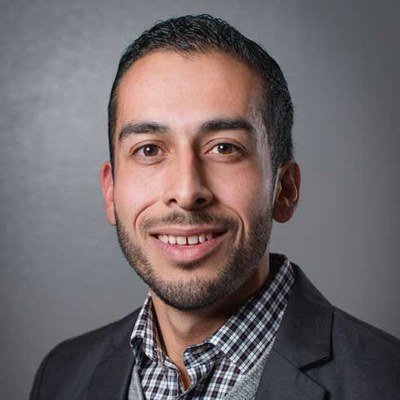

Alex Serna wrote this 2017 essay as a program director at a college access nonprofit, on what districts can learn from nonprofits about getting low-income, first-generation students to college. The section below the original adds current figures on first-generation college students and what they mean for schools.
Best Practices to Building Sustainability and Impact

Funding can either create program depth and breadth or drastically reduce it. Most non-profits operate modest budgets… lean organizations not by design, but by necessity. Thus requiring creative ways to leverage resources, building sustainability with no capital and focusing on essential high-impact actions. Likewise school districts operate on precarious budgets predicated on a mixture of federal, state and local monies within the context of competing interests for that much-needed funding. In essence, this leaves many school districts operating on a lean budget but wanting to do more with much less. The conflation of the two competing interests leaves many schools and students in underesourced communities struggling to meet outcomes, the most important being preparing youth for college and beyond.
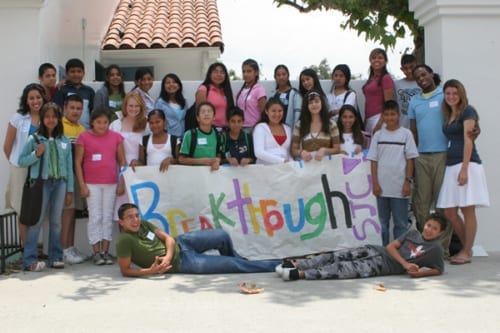
Nonprofits and community-based organizations exist to fill a void in access, resources or services to underserved communities. They are a bridge. In most cases, they have a focused mission to address whatever need they are trying to fill, thus directing all their energies on that goal. As a college access non-profit we exist to support low-income, first-generation students to attend college. In my work, there are three key best practices that allow us to build sustainability and have high-impact with less funding. As a strategy, these practices can enable school districts to do more with less.
Proactively seeking partnerships to leverage resources
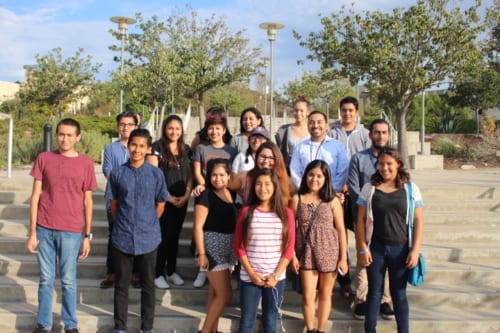
Mobilizing, train and utilize a volunteer base to amplify impact

Seeking Feedback, Piloting, Evaluating and Repeat
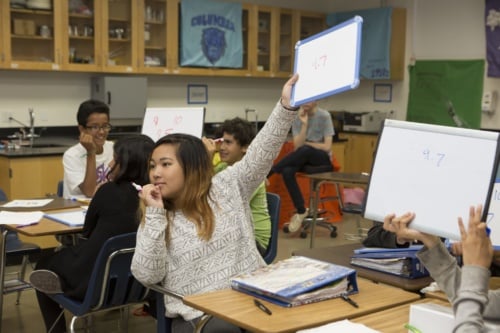
One day, my hope is that my nonprofit organization and others do not exist. Because, it will mean that the opportunity gap has been filled and structural inequities have been absolved. However, until then, nonprofits, school districts and other stakeholders need to listen and learn from one another. There is so much to do, with limited resources, for such a large endeavor.
First generation college students in 2026: who they are and what the current figures show
First generation college students are students enrolled in postsecondary education whose parents did not attend college. Alex Serna’s essay above quotes a figure from the Pell Institute for low-income, first-generation students. The most recent summary from the Postsecondary National Policy Institute, updated in January 2026, gives a fuller and newer picture, drawn mainly from data published by the National Center for Education Statistics.
How many students, and where they enroll
In 2019-20, 25.8 percent of undergraduates were first-generation. They were more likely than other students to attend public two-year colleges (37.1 percent compared with 29.3 percent of all students) and for-profit institutions (9.6 percent compared with 6.2 percent). The share of students who were first-generation was 45.8 percent among Latino students, 32.1 percent among Black students, 28.2 percent among Native American students, 27.2 percent among Asian students and 16.7 percent among White students. About 55 percent of first-generation students received a Pell Grant, compared with 35 percent of continuing-generation students. The summary also notes that in 2022, 42.5 percent of children lived in a household where their parent or guardian did not have a college degree.
What happens after enrollment
For students who first enrolled in 2011-12, 19 percent of first-generation students had earned a bachelor’s degree by 2017, compared with 46.6 percent of continuing-generation students, and 56.2 percent of first-generation students had earned no degree or certificate, compared with 37 percent of their peers. Among graduates ten years later, the summary reports average incomes of $68,278 for first-generation graduates and $78,720 for others. It also reports that 65 percent of first-generation graduates in 2019 owed $25,000 or more in student loans, compared with 57 percent of others.
These figures cannot be set directly beside the one Serna quotes. The Serna figure, 10.9 percent of low-income first-generation students earning a bachelor’s degree compared with 54 percent of students who were neither low-income nor first-generation, is for low-income first-generation students, and the Pell Institute report behind it was not opened for this section, so its cohort and follow-up period are not known here. The pattern is the same in both: a wide gap in degree completion. The sizes differ, and a district reporting its own results should say which definition it uses.
What this means for a district
Serna proposes three practices: partnering with outside organizations, training volunteers as mentors, and running quick cycles of feedback and change. The current figures give district leaders reasons to check how each one fits their students.
- Know who your first-generation students are. Many districts do not record this. A short, optional question on a senior survey, with a plain explanation of why it is asked, gives counselors a list to work from.
- Look beyond acceptance. The completion gap above shows that getting into college and finishing are separate problems. Serna’s mentor model, aimed at the application process, can be extended to the first year, when the figures suggest many students leave without a degree.
- Pay attention to where students enroll. Because a large share of first-generation students attend two-year and for-profit institutions, counselors should compare completion and loan outcomes at the colleges their graduates actually attend, not only the ones on their wall.
- Treat financial aid as part of counseling. With more than half of first-generation students receiving a Pell Grant, help with aid forms and award letters is central to enrollment decisions.
A caution about the numbers
The degree figures come from students who started college in 2011-12, so they describe an earlier group and not students now entering. They also describe national averages. A program like the one Serna runs, with 160 students, should compare itself with local data, not national totals. Definitions of first-generation also vary between sources, and the Institute uses the narrower one, students whose parents had not attended college at all.
For families, a useful step is to ask the school early, in ninth or tenth grade, who will help with applications and aid, and whether a local college access program or mentor is available. For counselors, the figures above make a case for tracking students from application through the first year of college and sharing the results with the nonprofits and colleges that partner with the school.
Further Reading
- The Mercury News – For first gen college students, getting accepted can be the least of their challenges
- The Santa Rosa Press Democrat – New SRJC official aims to make college more accessible
- The Topeka-Capital Journal – Editorial: Tracking first-generation students
Related reading
More on College Admissions